|
|
|
PC-ORD 7版最新更新
最新内容 |
新图形
|
-
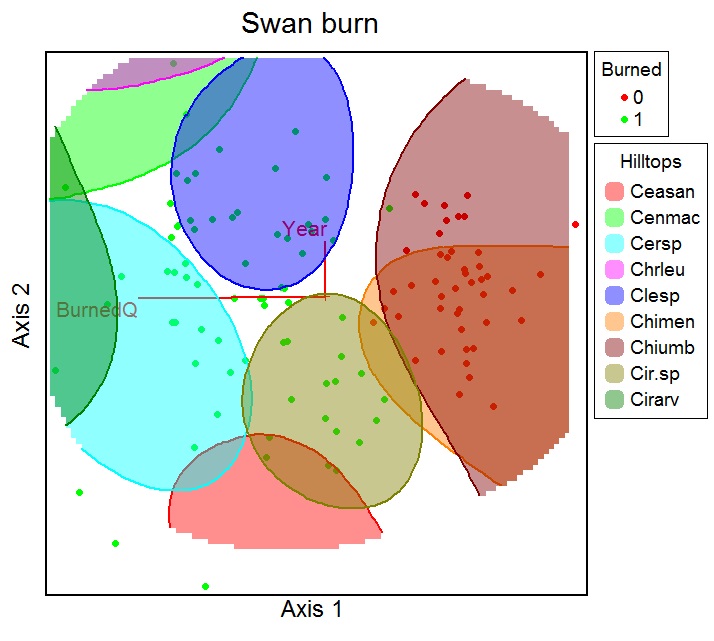
山顶图
-
山顶图是一种在单个图形上同时显示多个非线性响应面的方法。我们知道的首次使用是在Nelson等人(2015)的研究中。在PC-ORD中,响应面作为叠加层叠加在排序上。这使得能够同时测量和显示一维和二维的非线性群落-性状-环境关联。
对于每个选定的叠加变量,我们追踪特定的等高线,该等高线指定为该变量范围的百分比。每个包含区域都是一个"山顶",多个部分透明的山顶叠加在一个排序上。结果图在一个图中显示了多个非线性叠加变量(例如性状、物种丰度或环境变量)的最大值。
由于山顶基于等高线响应面,您可以通过阅读关于等高线叠加的内容来更好地理解山顶图的基础。山顶和等高线图在使用上的主要区别是,等高线图一次只能显示一个变量,而可以在同一个排序上绘制多个山顶。这会损失信息,因为在转换为山顶时会丢弃大部分等高线图,但具有一次表示多个非线性关系的优势。
-
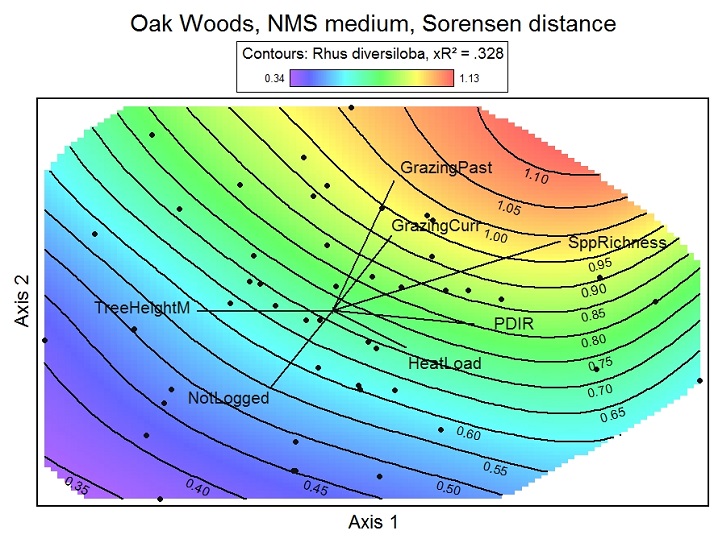
等高线叠加
-
当您选择Q变量作为叠加层时,您会得到一个表格,显示拟合如何随灵活性(平滑参数)而变化,该灵活性用于叠加变量与轴分数的非参数回归。如果您选择"优化"灵活性,PC-ORD将选择具有最高交叉验证拟合(xR)的灵活性。如果您希望为灵活性选择特定值,请选择"指定"灵活性。如果需要,可以使用"优化"下显示的表格来帮助您选择特定的灵活性。最后,您将获得一个叠加到排序空间上的等高线叠加层,您可以自定义它以包括颜色阴影和/或等高线间隔标记。
-
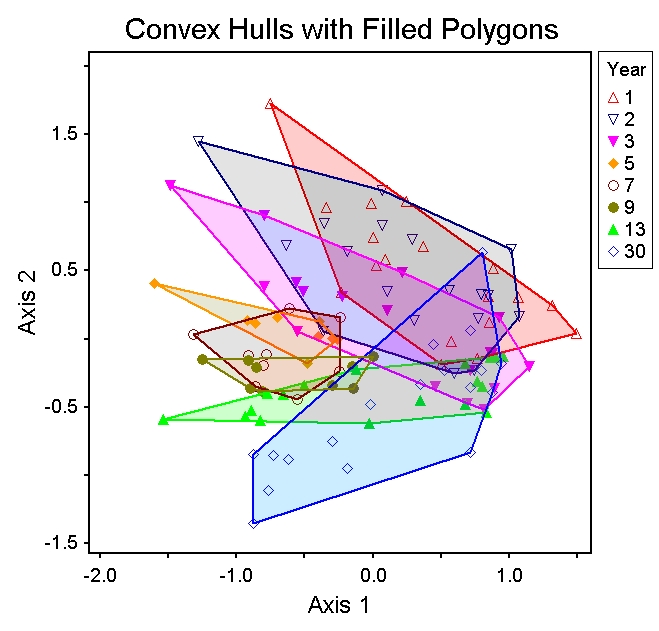
凸包填充多边形
凸包是一种使用多边形包围组内所有点的叠加层。此叠加层的目的是通过使用组在排序或散点图中的最外点来显示组的轮廓。这可以帮助查看者辨别组在散点图中是否分离以及如何重叠。
形成凸包的基本规则是将组内的外点连接成一个封闭的多边形,使得相邻线段总是形成小于或等于180度的内角。绘制凸包至少需要三个点。然而,只有三个点的凸包必须将每个点作为多边形的顶点(角)。
-
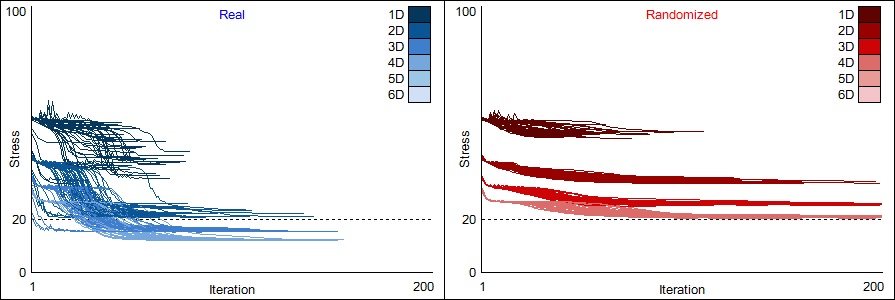
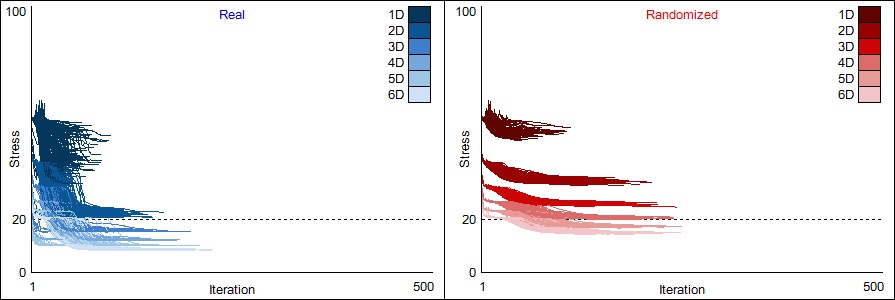
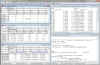
NMS迭代应力
-
| 中等4D解决方案 |
|
慢速6D解决方案 |
 |
- |
 |
| 点击图形查看更大图像 |
实时显示应力如何随NMS的每次迭代而变化。显示会随着尝试改进排序空间中点配置的每一步而更新。
此图形旨在既有趣又有信息性。有趣之处在于您可以获得一个动态、多彩、有趣的窗口来了解NMS的进展。对于每次运行和维度,您可以看到应力如何随着迭代次数的增加而减少。每个维度都有颜色编码,并为实际运行和随机运行显示单独的面板。
这些图形的信息性来自于对替代NMS解决方案的稳定性和一致性的洞察。不稳定的配置显示为垂直的锯齿形。一致性显示为给定水平上的最小应力平台。维度的重要性显示为随着维度增加而递减的最终应力系列。
|
|
性状
PC-ORD 7提供了将物种性状数据(性状矩阵)与群落样本(主矩阵)和环境数据(第二矩阵)关联的方法。虽然许多操作可以在其他PC-ORD菜单项中完成,但性状菜单提供了专门针对此类数据的几种操作。
|
- 功能多样性
功能多样性分析样本单位×物种矩阵与物种×性状矩阵的组合。功能多样性指标试图描述样本单位中代表的物种功能性状的多样性,而不仅仅是物种多样性。例如,包含三个物种的样地,如果所有物种都具有相同的性状,则被认为不如单个物种多样。同样,具有非常不同功能性状的两个物种比功能性状相似的两个物种贡献更多的功能多样性。例如,如果我们在一个样地中有两个物种,一个是喜阳光的先锋杂草植物物种,另一个是具有较差定殖能力的耐阴物种,那么该样地将比两个都是耐阴且定殖能力较差的不同物种具有更多的功能多样性。
- 第四角分析
通过样本单位×物种矩阵将物种性状与环境变量联系起来的方法论问题称为第四角问题,这是因为四个基本矩阵的排列(参见Dray和Legendre(2008,图1a)以及McCune和Grace(2002,图2.1)中的性状×环境位置)。第四角分析为这些矩阵之间联系的强度提供了统计检验。有关第四角分析的理论和数学的详细解释,请参见Legendre等人(1997)、Dray和Legendre(2008)、Ter Braak等人(2012)以及Dray等人(2014)。
- 分类转换为二进制
如果对于给定变量有n个唯一类别(即具有唯一值标签的类级别),则将生成n个新的二进制(0/1)变量。每个新变量将被指定为值为0或1的Q变量。
- 创建性状组合
通过组合两个现有变量的类别来创建一个新的分类变量。两个选定变量的每个类别组合都作为新变量中的一个新类别。结果的新变量始终是分类变量。现有变量保持不变,但您可以通过修改|删除列轻松删除它们。
例如,假设您有两个分类变量,一个编码为本地物种与非本地物种,一个编码为一年生植物与多年生植物。这在分析中可能效果很好,但是如果具有这些组合的物种,例如非本地一年生植物,在生态上与所有剩余物种特别不同怎么办?因此,您可能希望创建一个新的分类变量,包含这些性状类别的所有四种组合:(1)本地一年生植物,(2)本地多年生植物,(3)非本地一年生植物,(4)非本地多年生植物。
- 计算样本单位×性状矩阵
计算样本单位×性状矩阵为分析物种性状与解释变量之间的关系提供了灵活的第一步。该矩阵是通过将样本单位×物种矩阵乘以物种×性状矩阵获得的,但结果矩阵的内容取决于性状是否以及如何标准化,以及乘法是否跟随加权平均步骤(McCune 2015)。为了最大化样本单位×性状矩阵的多功能性,包括性状之间的可比性,以及与各种距离测量的可用性,我们建议首先将性状按最小值到最大值标准化,然后在每个样本单位中计算丰度加权性状平均值。
- 性状空间中的物种距离
可以通过计算物种之间的距离矩阵来比较物种的性状,从物种×性状矩阵开始。这在数学上与计算物种空间中样本单位之间的距离矩阵相同,只是在这种情况下对象是物种,它们的属性是性状,而不是对象是样本单位,属性是物种。性状菜单提供与物种空间中样本单位之间的距离相同的距离测量。
|
|
新矩阵文件格式
界面 |
|
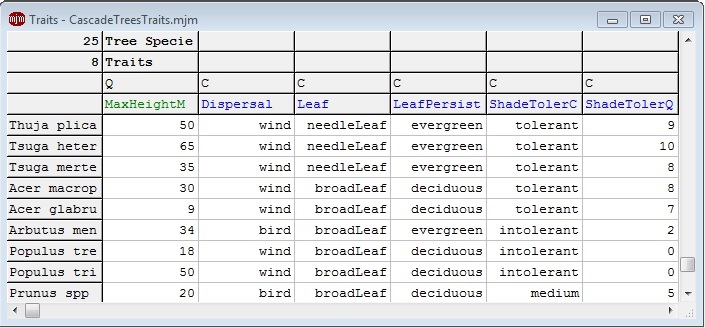
- 行和列标识符 最大长度从8个字符增加到
12个字符。
- 分类值 现在可以是数值(上例中的ShadeTolerQ)或文本(上例中的Dispersal、Leaf、Leaf、LearPersist和ShadeTolerC),最多
20个字符。
- 矩阵大小 从32,000行×32,000列增加到
2,000,000行×2,000,000列,最多536,848,900个元素,有一些限制。
- 注意:您仍然可以导入Excel旧的.wk1文件以及.xls和.xlsx文件。
|
|
|
新分析
|
- 第四角分析
通过样本单位 × 物种矩阵将物种性状与环境变量关联起来的方法学问题,被称为第四角问题(Fourth Corner Problem),这一命名源于四个基础矩阵的排列方式(参见 Dray & Legendre 2008,图 1a 及 McCune & Grace 2002,图 2.1 中的性状 × 环境位置)。
** 第四角分析(Fourth Corner Analysis)** 可对这些矩阵之间关联强度进行统计检验。
如需了解第四角分析的理论与数学原理的详细说明,可参考 Legendre 等(1997)、Dray & Legendre(2008)、Ter Braak 等(2012)及 Dray 等(2014)的文献。
- 模糊集(FSO)
模糊集排序将模糊集理论应用于生态排序中的直接梯度分析。这种排序方法要求用户假设物种群落与环境变量或其他预测因子之间的关系。预测因子最常见的是环境变量,但也可以是次要的物种群落集,或任何其他与群落矩阵具有相同行数的定量数据集。群落数据放在主矩阵中,次要集在第二矩阵中。结果排序是物种空间中样本单位的排序。物种可以通过单个加权平均步骤叠加到排序上
- 基于距离的冗余分析
基于距离的冗余分析(dbRDA)与冗余分析(RDA)相似,只是主矩阵被其主坐标替换,使用您选择的距离测量。这种变体的目的是允许您选择非欧几里得距离测量,例如Sorensen(Bray-Curtis),这在群落生态学中被证明是有效的。
- 分类计数
分类计数提供了一种跟踪具有给定分类值的案例数(行,通常是样本单位)的方法。默认情况下,这是对选定矩阵中的所有分类变量进行的。这提供了类别频率的快速评估,对于实验设计中的平衡或不同类别中的采样有效性等问题很有用。
- 功能多样性
功能多样性分析样本单位×物种矩阵与物种×性状矩阵的组合。PC-ORD中功能多样性指标的原理和使用在以下主题中描述。
|
|
现有分析的补充
|
- Gower距离
Gower(1971a)系数在相似性或相异性测量中非常不寻常,因为它可以基于定性(分类)数据、定量数据或两者的混合进行计算。分类数据作为匹配问题处理:共享定性属性的项目从该属性获得一个单位的相似性。有关该方法的详细描述,请参见Legendre和Legendre(1998)。
- Gower距离,忽略0,0
Gower(1971)以及Legendre和Legendre(1998)提出了一个有趣但基本未经测试的Gower相似系数变体,该变体忽略0,0数据对。如果这些双重零被认为是模糊信息,您可以将它们从系数的计算中排除。对双重零的敏感性在群落生态学中是众所周知的,它会在分析中产生不想要的影响(Legendre & Legendre 1989, p. 253; McCune & Grace 2002, p. 38, 51)。
Legendre和Legendre(1998)提出了Gower相似系数的修改版本(S19),称其为"非对称",因为匹配零的处理方式与非零不同。这与Gower系数相同,只是对于定量变量,(0,0)对被排除,部分相似性的总和因此不是除以p个变量,而是除以p*非(0,0)对的数量。
请注意,这种"非对称"的含义与矩阵对称性不同。如果Legendre的Gower相似性的非对称版本被转换为距离(或相异性)并用于构建距离矩阵,这仍然是一个对称矩阵。换句话说,项目A和B之间的距离与B和A之间的距离相同,即使使用Gower相似性的非对称版本。为了避免这种混淆,PC-ORD在菜单系统和输出文件中使用术语"Gower, Ignore 0,0"。
- Morisita-Horn距离
Horn(1966)修改了Morisita(1959)的相似性测量,产生了现在被称为Morista-Horn相似性或距离的结果。这种距离测量的主要优点是它对采样努力相对不敏感(Wolda 1981)。因此,它对于无法控制采样时间、面积或体积的情况最有用。
Morisita-Horn指数仅受稀有种的微弱影响,这很大程度上是该方法对采样不足具有抵抗力的原因。同时,它使该方法对稀有种携带的模式不敏感。
- 将perMANOVA和指示物种分析中的块或组的最大数量增加到1000
- 新的摘要|写入距离矩阵选项:
|
图表增强功能
- 新增应用按钮,无需退出偏好设置对话框即可实时预览修改效果
- 可将分组质心得分保存至电子表格或文本文件
- 支持将图表保存为 TIFF 格式
- 物种频次标签阈值设置
- 第三坐标轴叠加显示
- 刻度标记数量自定义控制
- 图例顺序重新排序
- 工具栏自定义设置
数据格式与管理功能改进
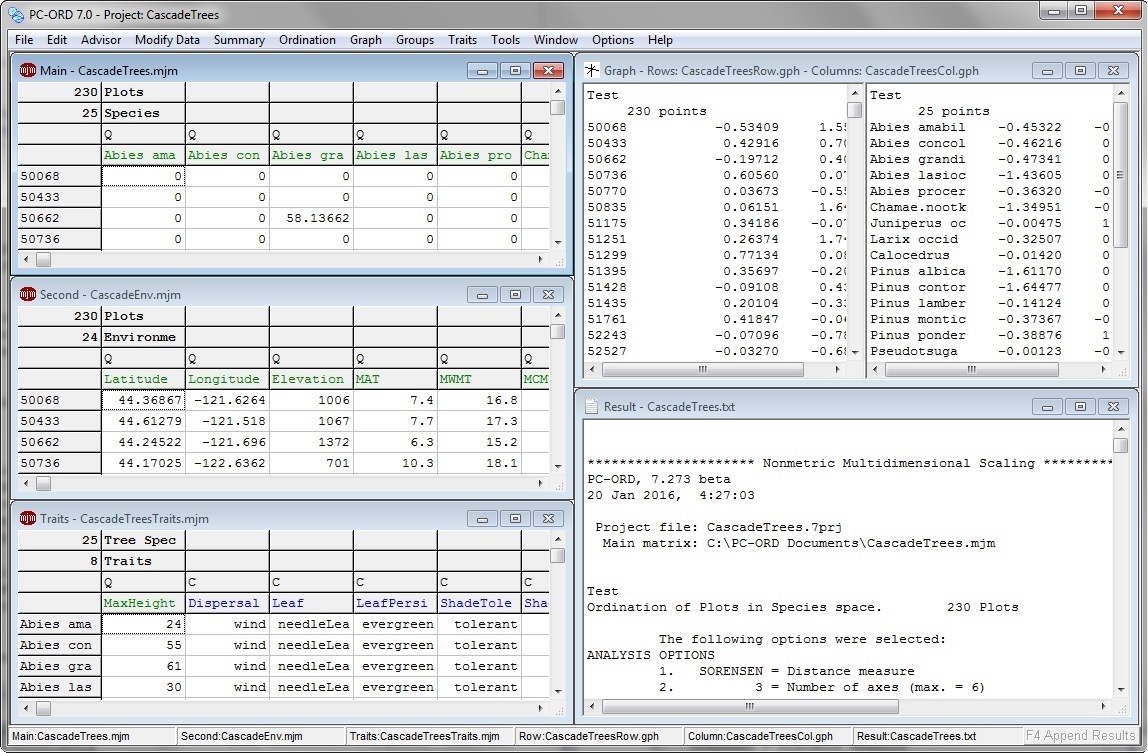
- 新增性状窗口,可同时显示物种性状矩阵。
- 分类变量类型支持文本输入。例如,实验处理的分类变量无需再编码为 1、2、3,可直接命名为"burned", "mowed"和 “control”。相应地,分类变量将不再支持算术运算,仅用于定义项目分组。
- 支持变量类型转换:
- 分类变量 → 定量变量
- 定量变量 → 分类变量
- 分类变量 → 二分类变量
- 行名与列名(缩写)最大长度提升至 12 个字符,详见《限制说明》。
- 电子表格设计支持最多 200 万行或列,详见《限制说明》与内存使用说明。
- 简化 Excel 导入 / 导出流程。
- 全新项目设计:支持矩阵拖放设置,文件管理更便捷。
- 全部保存功能:可使用统一基础文件名批量保存相关新文件。
- 导出项目功能:可便捷地将指定项目的全部文件与设置从一台电脑迁移至另一台。
- 优化「文件 → 导入简单电子表格」选项,支持为矩阵指定单元格区域。
- 紧凑格式:编码数值最大长度从 4 位提升至 8 位;编码名称(物种缩写)最大长度从 8 个字符提升至 12 个字符。
- 支持点击拖动切换矩阵。
- 可将主矩阵或第二矩阵转换为图形文件,便于使用 PC‑ORD 外部生成的排序坐标。在 6 版本中,该功能仅以插件 “wk1togph” 形式提供。
- 支持重编码分类变量(数字转文本、文本转文本)。
- 内置免费升级至最新版本
- 通过网络下载并使用许可证密钥进行分发
本书为第二版,专为数据分析入门者量身打造,同时也包含对高阶用户极具价值的方法与技巧。书中采用第 5–7 版软件均适用的工具,通过10 步分析流程,为能够参与与无法参与 PC‑ORD 培训的用户均提供指导。
在线留言
尊敬的客户朋友,如您有任何意见建议,请通过下表反馈给我们,我们会尽快与您联系。
|
|
|