|
|
CANOCO常见问题
是的,您可以从旧版本的Canoco升级。 请联系我们以获得有关可用性和定价的更准确信息。
Canoco 5在32位和64位版本的标准台式机和笔记本电脑上运行良好,适用于Canoco 5发布时的32位和64位版本。 Window 8.x和10还支持其他平台,例如通过用手指触摸屏幕管理的小型移动设备,但是,正如任何分析和可视化科学数据的程序一样,Canoco 5也不会擅长。 Canoco 5也适用于其他Microsoft操作系统,从安装了Microsoft Windows XP SP2或SP3的开始。 这还包括Windows Vista和Windows 7。 Canoco 5在这些操作系统中没有原生实现,但是Canoco 5经测试可以在Linux的Wine或类似CrossOver包环境下运行。下面的截屏描述了Canoco工作在Ubuntu Linux工作空间生成的双标图(biplot)。
在Canoco 5包中现在只有一个应用程序,安装程序根据Windows版本(32位或64位)来安装相应的版本(32位或64位)。文件读取和保存在Canoco 5的32位和64位版本之间兼容。
The bug in the original DECORANA (Hill, 1979) code for Detrended Correspondence Analysis has been studied and was repaired before Canoco 4 version, 15 years ago. It turned out that the change suggested by Oksanen and Minchin (1997) did not make the smoothing routine order-invariant. Another change was required as well, as agreed upon by Oksanen & Minchin in subsequent correspondence (see http://cc.oulu.fi/~jarioksa/pages/isbug.htm). 是的,non-metric multidimensional scaling (NMDS or NMS)方法现在已经完全集成到Canoco 5中,替换了先前版本中的插件程序WinKyst。WinKyst程序被保留,作为执行NMDS分析的备选方案。 In addition, Canoco 5 provides a wide array of ordination methods that operate directly on the data, instead of on derived similarity or dissimilarity (distance) measures, as NMDS does. The advantage of these methods over NMDS are that:
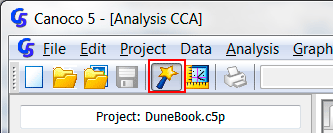
是的,肯定是,而且可以是更大的数据。在个人电脑上总有能分析的数据大小的限制,然而在5版中,Canoco自己限制为1.67亿表格行,1.67亿表格列。然而,操作系统强加了更严格的限制,即在32位Windows的情况下。 标准应用程序无法在32位Windows中分配超过2 GB的内存,但Canoco 5使用特殊配置将其数据空间扩展到3 GB(在正确的Windows重新配置之后)。 单个连续的内存块不能分配大于1 GB的大小,因此Canoco 5数据表限制为大约1.34亿个条目。 另一个限制通常来自处理器速度,使得真正大数据的分析难以忍受地缓慢(但是你可以让计算机工作一整夜)。 Canoco 5主要侧重于排序方法,而PC-ORD提供了大量的方法,包括聚类分析,TWINSPAN, species-area curves, Mantel test 和 similar distance-based permutation tests. Naturally, both programs continue to develop. Version 6 of PC-ORD added linear constrained ordination (redundancy analysis - RDA) that was missing in previous versions, while Canoco 5 adds the non-metric multidimensional scaling (NMDS) that was previously available only as a (free) add-on package. Canoco 5 features the symmetric form of co-correspondence analysis to relate two biotic communities together. Both Canoco 5 and PC-ORD are valuable analytical tools which can be used to corroborate one another where they offer overlapping functionality. Each complements the other with analyses not available in the other package. Most important is the comparison of prices, where MjM company boasts about a substantially cheaper product, but the comparison for a single user license compares a personal license of PC-ORD with a Canoco price for private companies. A fairer comparison would be among educational licenses purchased by an academic department for its employee. As the PC-ORD pages tell you, if the license should stay at the institution which bought it for you, the price is – for a single user – 299 + 100 USD, which does not compare so well with a single educational license of 368 USD for Canoco 5 (same as for Canoco 4.5). Similarly, the student licenses are offered for Canoco as additional educational licenses for 238 USD, which does not compare so badly with the 199 USD for PC-ORD. It is only fair to add that shipping costs are smaller for PC-ORD. As a rather minor point, we shall note that Canoco 4.5 had (and continues to have in version 5) the "successional vectors" called series collections in PC-ORD, that monotonic transformations (namely log and sqrt) are available, as are the diversity indices computed for individual cases, and the detection of outliers with leverage statistics for individual predictors as well as for their whole set. The vegan package in the R program implements most of the methods available in Canoco 5 as well as a few more. But as R is an open system, those Canoco methods missing in vegan can be found in other packages, related or unrelated to vegan. However, the R environment is primarily command-oriented and to import data, perform analysis or create simple ordination diagrams, commands calling functions are needed, often with a complex set of function parameters to correctly choose from. We see the R environment as excellent for a statistically-oriented ecologist, but for researchers focused on their research subjects, using vegan in the R environment has a steep learning curve, which must be climbed repeatedly for someone evaluating their data after long periods of work in field or lab. There is a relatively user-friendly interface in the Rcmdr package, offering in combination with the DiversityR package some of the multivariate methods of vegan, but only for a small subset, excluding all the advanced methods and advanced options. When you start to use Canoco 5 on a particular user account, the Analysis Setup Wizard is shown in so-called QuickWizard mode. This is reflected in the QuickWizard button (emphasized by a red rectangle in the following snapshot) being shown in depressed state.
Whenever you want to omit (or weight) cases or response variables, you must switch the QuickWizard mode off by clicking once this button (its look then becomes flat), before creating the new analysis (e.g. clicking the Newbutton below the list of analyses) or before changing options for an existing analysis (e.g. by clicking the Modifybutton and then selecting Replace in existing analysis). With QuickWizard mode switched off, the Analysis Setup Wizard shows more pages, including the Response and Explanatory Data page:
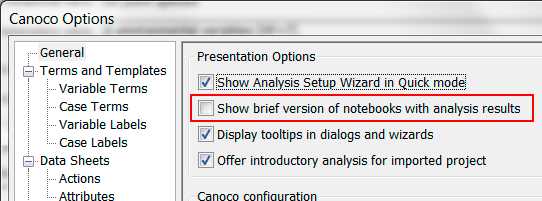
If you check (as in the above snapshot) one or both boxes labelled "Select"..., the setup wizard will later show corresponding pages where a subset of cases and/or response variables can be selected for the analysis. To switch the QuickWizard mode on again, you click the same button in the toolbar (it is a toggle button). You can define groups of cases and of variables using the Project | Groups | of ... menu commands and then select or omit cases or variables belonging to a particular group by using the From group button on the respective item selection page of the setup wizard. The ordination scores and additional ordination statistics that could be obtained in CANOCO 4.x versions from a solution (.SOL) file are still available in Canoco 5 analyses, but normally they are not shown. When you start using Canoco 5 on a particular user account, the analysis notebooks are shown in a brief mode with only the summarizing pages and created graphs available, the other information (ordination scores and analysis log) being hidden. To display analysis notebook in a non-brief mode, you must select the Edit | Settings | Canoco5 optionscommand from the main menu and in the General page of the Canoco Options dialog box uncheck the "Show brief version of notebooks with analysis results" box:
- closing then the dialog with OK button. Please note that already displayed notebooks do not change its contents after this change in options. You must close the notebook (e.g. using the Hide button below the list of analyses) and then reopen it again (e.g. using theShow button that replaces the Hide button for an analysis with closed notebook). When hiding and re-displaying analysis notebook, you should note that if there are multiple analyses defined and an analysis notebook is hidden, the focus often switches to another analysis. So to re-open the analysis notebook for the original analysis, you must re-select it in the list of analyses. The scores shown in the score pages can be copied to Clipboard and further reused within or outside of the Canoco 5 program. There are two context menu commands for copying selected score columns:Copy scorescopies the table contents as seen in the score page, whileCopy expanded aligns the set of rows with the corresponding set of data items (cases, response variables, etc.) present in the project: this is important when you want to copy computed scores into the project as a new data table (some data items might be absent in the analysis output, factor variables on the other hand generate more than one set of scores). You might need to execute principal components analysis (PCA) on your data, for example, and you want to log-transform the values of the variables used in this PCA. But when you arrive to the appropriate setup wizard page, the log transformation is not available:
Why is it so? There are essentially two possibilites:
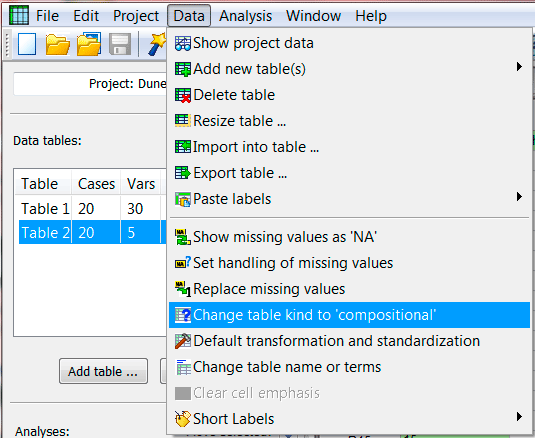
(b) Your data table is correctly specified as a general type. Different columns of such data table are measured in different units or – if the units are identical for all of them – it still does not make sense to sum them up. This is the case with many data sets characterising the environment in which a community was sampled (e.g. water analysis results, soil chemistry analysis results etc.). In such a case, you can still specify transformations of the variables, but you must do it for each of them separately (because, likely, the chosen transformations will differ across the variables). These transformations can be specified by selecting the concerned data table in the upper left area of the Canoco workspace and then the Data | Default transformation and standardization menu command from the Canoco 5 menu. This command displays following dialog box where you can select individual variables (except the factor variables) and then choose an appropriate transformation. In fact, Canoco Adviser tries to suggest transformation type, but its scope is limited to the choice between “No transformation” and log-transformation (suggesting appropriate constants in the latter case).
With the default transformations set, they are used always when the concerned variable is used in an analysis, whether you use it as a response variable or as a predictor variable (explanatory, supplementary or covariate). To make sure this happens, you can either check back at the Variable Transformations dialog box or you can inspect the Log tab of the analysis notebook (see the previous FAQ 12, How can I display ordination score values, for the description of how to display analysis notebook in a non-brief mode).
|
|
|
||||||||||||||||||||||||