8版本最新更新
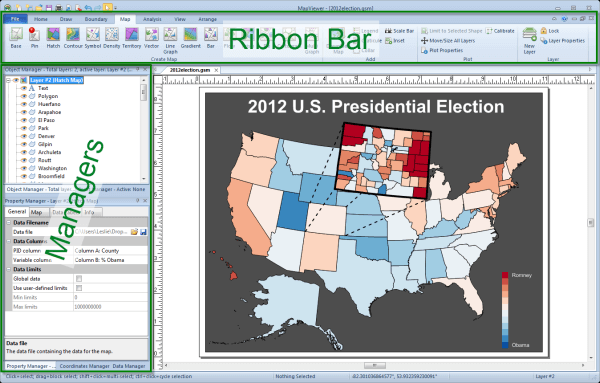
我们已经编译了MapViewer 8中一些最重要的新功能的列表。此列表只是添加到MapViewer 8中的新功能的一小部分。 New and Improved User-Interface Find commands more easily than ever with the new ribbon bar user-interface. Commonly-used commands have larger icons to make them easier to find, and commands are grouped in more intuitive ways. Additionally, find customization tools more easily than ever in the newly-redesigned managers. 此
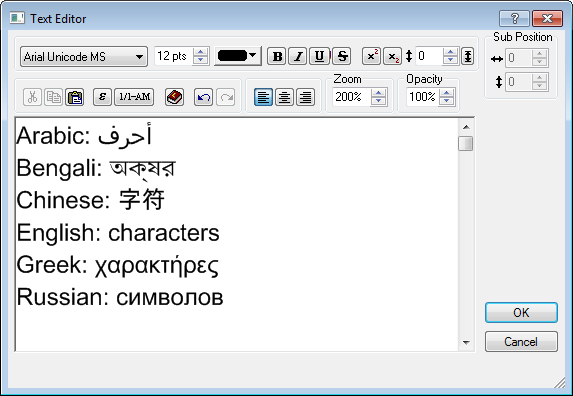
 Create Multi-Graph Maps Multi-graph maps are a new thematic map type that display a unique line graph in or on each map boundary. Multi-graph maps make it easy to compare continuous information (like population over time) for multiple areas at once. 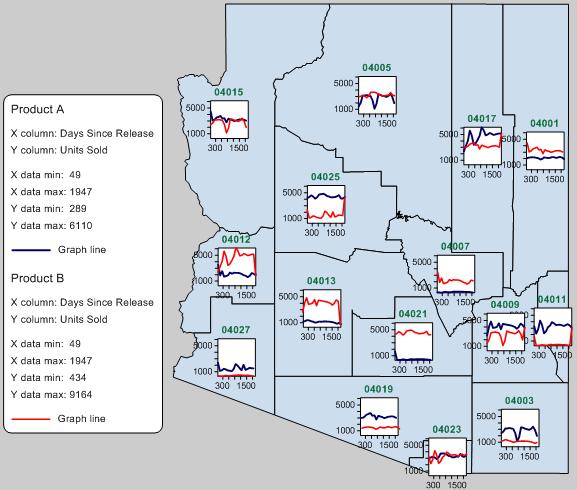 Create Bivariate Symbol Maps Symbol Maps have been an effective means of communicating data in previous versions of MapViewer, but they are even more powerful in MapViewer 8. Now you can color your symbols by a different variable than the variable with which you sized the symbols. This new feature doubles the amount of information your map conveys! 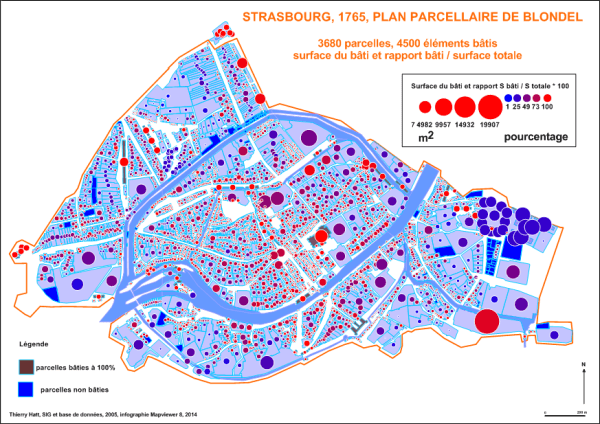 Create Contiguous Cartogram Maps Contiguous cartograms are maps that vary the area of a map boundary based on a variable, and maintain the connectivity of adjacent boundaries at the expense of shape. Use this intriguing new cartogram map feature to display your data in an obvious and interesting way. 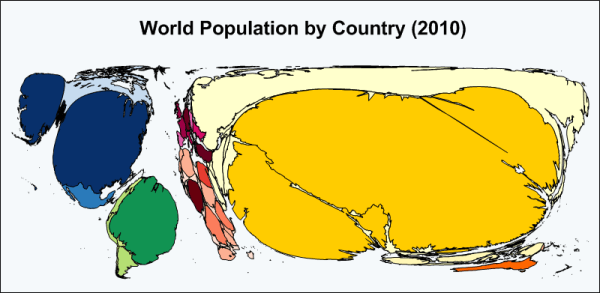 Create Proportional Pin Maps Exercise full control over your pin map display by using the proportional symbol size pin map method. This allows you to set a minimum and maximum symbol size, then have the symbol sizes vary within that range based on the values in your data column. 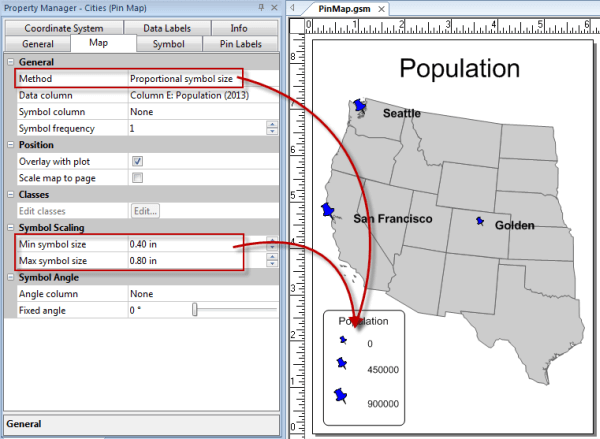 Download Online Maps More information is now at your fingertips. Download image layers from hundreds of free online Web Mapping Services (WMS) through MapViewer’s new, integrated WMS browser. Connect to online data sources, pick the layers of interest you want to download, and MapViewer seamlessly downloads the images into your projects. 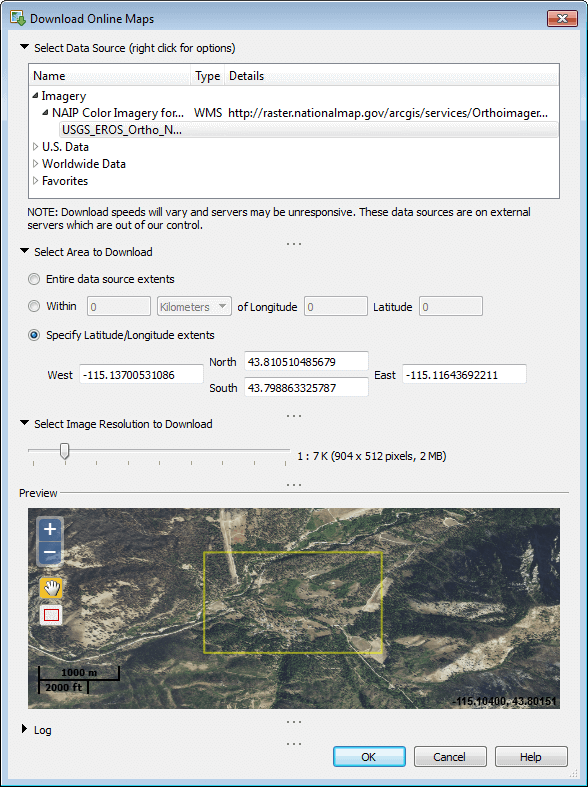 Query Across Multiple Layers No longer are you limited to querying only objects in the same layer. Now select points from one layer that are within boundaries on another layer, apply properties to polygons on separate layers that share a given criteria, etc. MapViewer will show you patterns in your data you never knew existed! 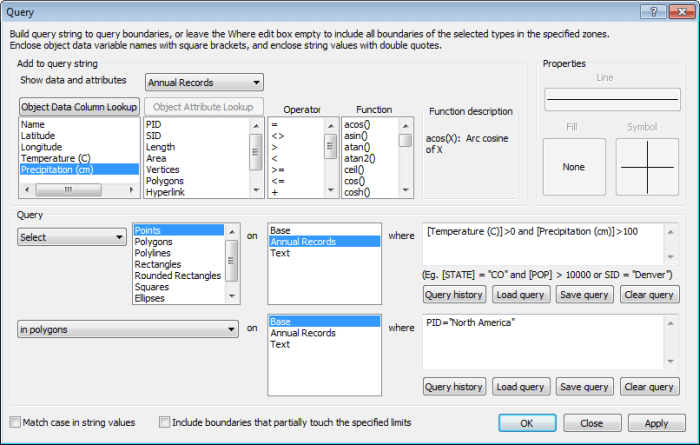 Use Text Columns for Territory Map Territories or Choropleth (Hatch) Map Classes It’s finally here! Create the same visually-dynamic choropleth maps and territory maps you always have, but use text variables rather than assigning these to data values. Eliminate tedious data reformatting forever! 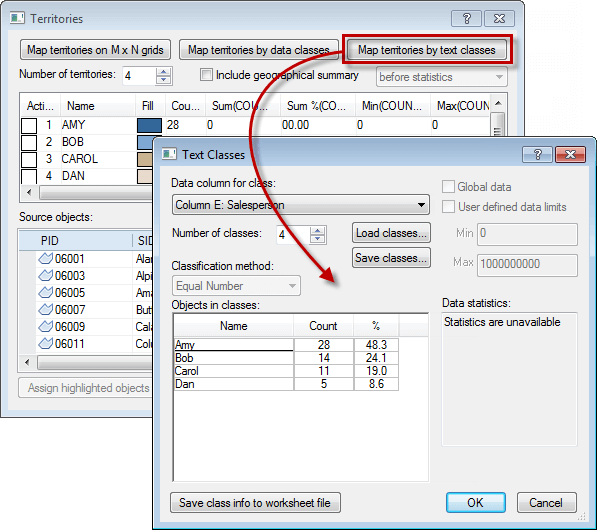 Increased Customization of Data Labels Customize your map presentation by adding data labels from any data column, changing the font/format of labels, moving all labels in as set or individual labels, and adding leader lines. Your maps will look exactly how you want with minimal effort!  Support for Unlimited Number of Attributes Import an unlimited number of attributes with your boundaries for use as data labels to present a myriad of information about your map. 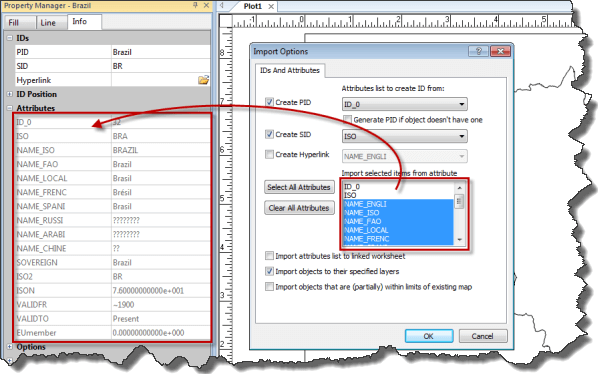 处显示 class "imgReSize" 的内容 处显示 class "imgReSize" 的内容Embed Data in MapViewer Project (GSM) Files Have trouble remembering where your data files went? Forget to send the data files with the GSM file when you’re sharing your project with a coworker or technical support? Never again. The redesigned GSM file allows you to embed data so one file is all you need! 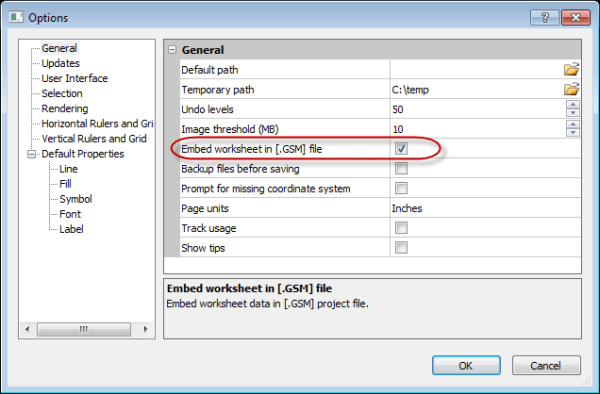 Improved Coordinate System Dialog Benefit from a flexible new coordinate system dialog that lays out the systems in a more intuitive fashion. Additionally, new functionality has been added to search for coordinate systems to make it easier than ever to find your desired system. Surfer users will find this dialog familiar and will delight in the improvement, since this dialog and Surfer’s are one and the same.  Font/Format Support for Legend Entries Add a custom legend to your plot to give all of the information that your audience needs to get out the valuable information you put into your maps. Use the new Font Properties and Label Format sections to add prefixes and suffixes to your legend entries, modify the font size and color, and so much more! 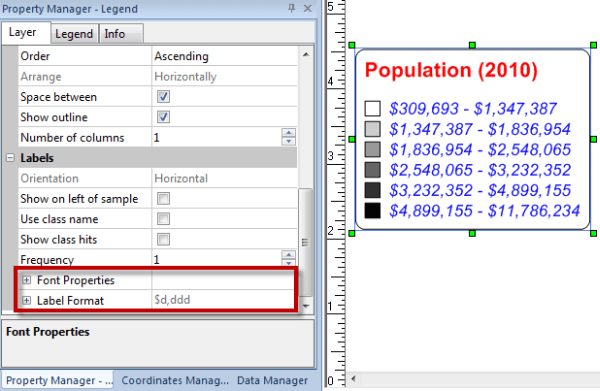 New Import/Export Formats Take advantage of the newly available or enhanced import and export formats!
New Coordinate Systems, Datums, and Projections
Additional New Features In addition to the mind-blowing features listed above, here are a few more long-awaited and highly sought-after new features:
 系统需求
在线留言尊敬的客户朋友,如您有任何意见建议,请通过下表反馈给我们,我们会尽快与您联系。
|
|
|
|||||||||||||||||||||||||||||