|
EViews 12 Econometrics and Statistics: Testing and Diagnostics EViews 12 introduces a suite of new post-estimation diagnostics, as well as statistical tests and procedures:
IMPULSE RESPONSE ENHANCEMENTS EViews 12 features a set of improvements for computing and displaying impulse responses and confidence intervals for VAR and VEC estimators.
New Interface The prior impulse response interface coupled the choices for which impulses and responses to display and the method in which they were displayed, with the various options for computing the impulse response and standard error. Thus, if a user first displayed a multiple graph of impulse responses and then wanted to show the results in a table, or perhaps display a subset of those original responses, the procedure would have to be respecified and recomputed from the beginning. The new, dynamic EViews 12 interface allows for interactive selection of the impulse and responses to be displayed, as well as the method of display. 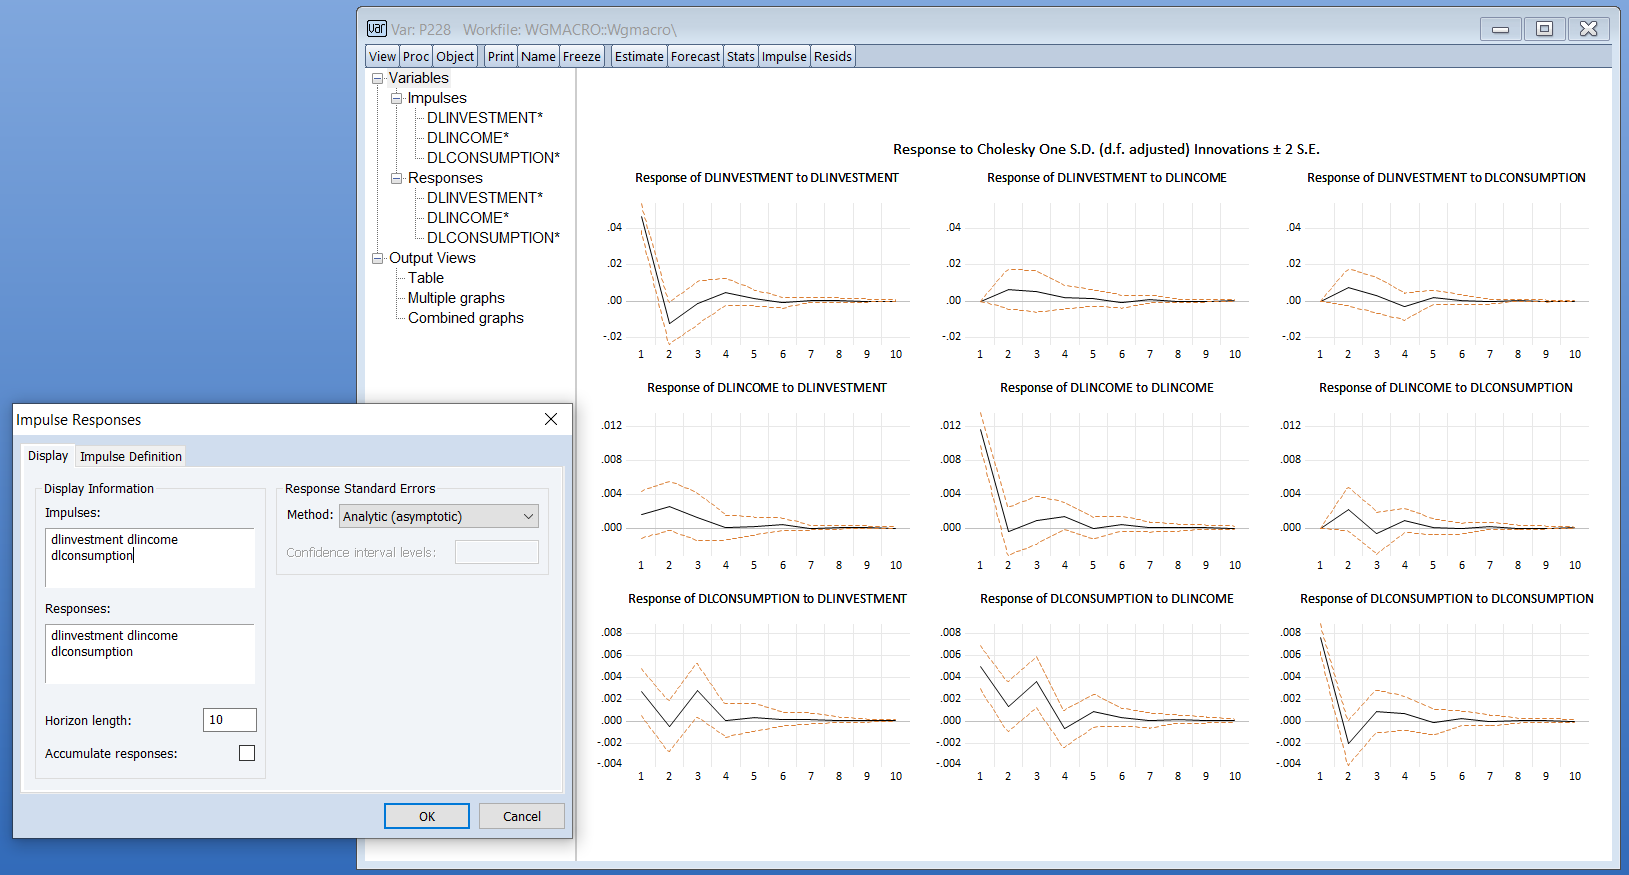 Bootstrap Confidence Intervals EViews 12 introduces several new bootstrapping approaches to computing the confidence intervals for both VAR and VEC impulse responses. These new tools allow you to compute residual bootstrap, residual double bootstrap, and fast residual double bootstrap estimates of these confidence intervals. EViews supports a variety of confidence interval bootstrap methods, including standard percentile, Hall’s (1992) percentile confidence intervals, Hall’s (1986) studentized confidence interval, and Killian’s (1998) unbiased confidence interval. 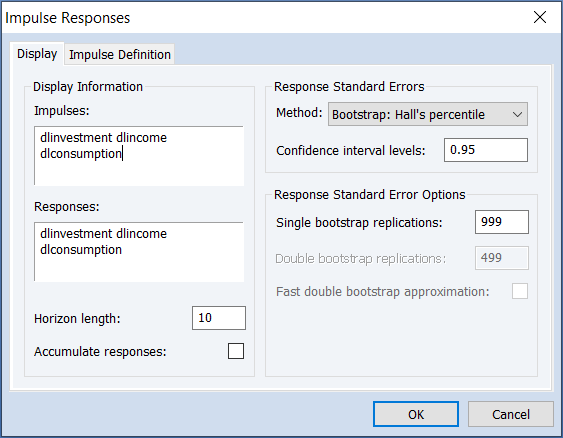 CROSS-SECTIONALLY DEPENDENT PANEL UNIT ROOT TESTS Since many economic time series have short samples but are observed over many cross-sections, multivariate unit root tests that combine results for different cross-sections, colloquially referred to as first generation panel unit root tests, offered improved statistical power over their univariate counterparts. These first generation panel unit root tests involve unit root testing on pooled panel data, with (possibly) individual trend, intercepts, and lag coefficients. While this framework is a natural first step, it comes at the steep cost of requiring cross-sectional independence. Tests which account for cross-sectional dependence have been termed second generation panel unit root tests. EViews current supports two important second generation contributions: Panel Analysis of Nonstationarity in Idiosyncratic and Common Components (PANIC) due to Bai and Ng (2004), and Cross-sectionally Augmented IPS (CIPS), developed by Pesaran (2007). FACTOR SELECTION METHODS EViews 12 adds the Bai and Ng (2002) and Ahn and Horenstein (2013) methods for determining the number of factors to retain to our existing principal components and factor analysis engines, as well as the new cross-sectionally dependent panel unit root tests.  WAVELET DECOMPOSITIONS Wavelet decomposition is a new Series view and procedure that can decompose a series into its long-run behavior (smooths) and short run behavior (details). Among other things, wavelets may be used to:
ELASTIC NET, RIDGE AND LASSO ENHANCEMENTS Elastic Net (ENET) estimation, including the Ridge Regression and LASSO Estimation models, was added in EViews 11, and has proven a popular addition to the machine learning tools in EViews. We have enhanced ENET in EViews 12 with the following features:
GARCH DIAGNOSTICS GARCH models have been a fundamental part of the EViews estimation tool kit for over thirty years, and EViews 12 increases the toolkit by adding three new diagnostic views of GARCH models.
IHS Global Inc.是EViews软件的制造商 © 2020 IHS Global Inc. All Rights Reserved.
|
|
|
| 站点地图|隐私政策|加入我们 |
Copyright © 2022 上海卡贝信息技术有限公司 All rights reserved. |
